
By July 2022, global inflation has decisively shattered the “transitory” consensus that prevailed across central banks in 2021. On 13 July 2022, the U.S. Bureau of Labor Statistics reported that June 2022 Consumer Price Index (CPI) inflation accelerated to 9.1% year-on-year—the fastest pace since November 1981—compelling the Federal Open Market Committee (FOMC) to deliver back-to-back 75-basis-point rate hikes in June and July 2022. Here in Singapore, June 2022 MAS Core Inflation rose to 4.4% year-on-year (a 13-year high) while Headline CPI-All Items reached 6.7% year-on-year, prompting the Monetary Authority of Singapore (MAS) to execute an off-cycle monetary policy tightening on 14 July 2022. Understanding the structural drivers of this regime—and why Singapore fights inflation through its exchange rate rather than domestic interest rates—is essential for every allocator and household.
1. Cost-Push vs. Demand-Pull: The AD–AS Macroeconomic Framework
In neoclassical and Keynesian macroeconomics, the aggregate price level (P) and real national output (Y) are determined by the equilibrium of Aggregate Demand (AD = C + I + G + (X − M)) and Short-Run Aggregate Supply (SRAS). Unlike the demand-driven recoveries of the 2000s, the 2021–2022 inflationary regime represents a simultaneous shock to both curves:
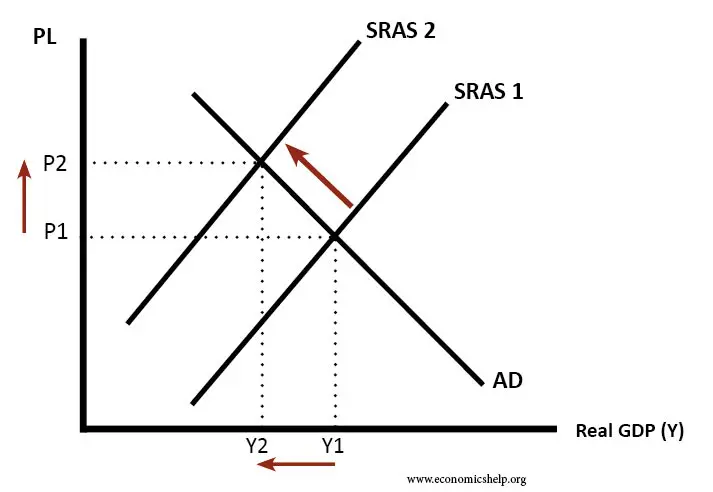
- Cost-Push Inflation (SRAS Shifts Left from SRAS1 to SRAS2): Originating on the supply side, exogenous shocks raise unit input costs across energy, commodities, logistics, and labour. Following the outbreak of the Russia–Ukraine war in February 2022, Brent crude oil surged into the US$110–125/bbl range, European natural gas spiked, and global exports of wheat, corn, sunflower oil, and nitrogen fertilizers were severely curtailed. In Singapore, electricity and gas tariffs rose 20% YoY in Q2 2022, regional food supply disruptions (including Malaysia’s June 2022 live broiler chicken export ban) pushed food inflation to 5.4% YoY in June, and tight domestic labour markets drove resident average monthly earnings up 7.8% YoY in Q1 2022. A leftward shift in SRAS pushes the general price level up (P1 → P2) while exerting downward drag on real output (Y1 → Y2).
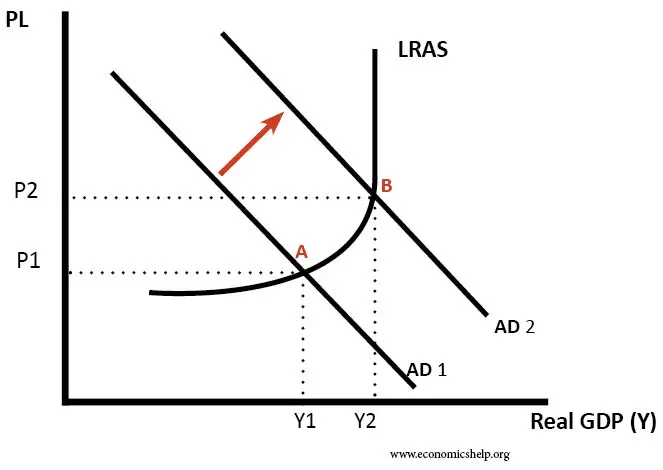
- Demand-Pull Inflation (AD Shifts Right from AD1 to AD2): Originating on the spending side, historic pandemic-era fiscal stimulus, expansionary global money supply growth (M2), and pent-up household savings collided with the reopening of international borders and domestic services in Q2 2022. Singapore’s economy expanded 4.8% YoY in Q2 2022 (MTI Advance Estimates), closing the negative output gap and giving consumer-facing businesses strong pricing power to pass higher input and wage costs onto final retail prices.
2. Headline CPI vs. MAS Core Inflation: What Is Inside the Basket?
A critical distinction in Singapore macro analysis is the difference between CPI-All Items (Headline Inflation) and MAS Core Inflation. Unlike the US Federal Reserve—where “Core CPI/PCE” excludes volatile food and energy prices—MAS Core Inflation includes food and energy (because imported food and energy are central to household consumption in a city-state) and instead excludes Accommodation (imputed rentals and housing costs) and Private Transport (Certificate of Entitlement [COE] premiums and motor cars), which are heavily influenced by administrative supply quotas and property cooling measures.
3. How Singapore Fights Inflation: The S$NEER BBC Framework & 2021–2022 Policy Timeline
Under the open-economy Mundell–Fleming Impossible Trinity, an economy with free capital mobility cannot simultaneously fix its exchange rate and conduct independent interest-rate policy. Because Singapore’s total external trade exceeds 300% of GDP and roughly 40% of every dollar of domestic consumption is imported, MAS uses the Singapore Dollar Nominal Effective Exchange Rate (S$NEER) as its intermediate monetary policy target through the Basket, Band, and Crawl (BBC) system—leaving domestic interest rates (SORA and SIBOR) to be determined by global rate parity.
| Policy Date | MAS Cycle Type | S$NEER Policy Action | Macro Context & Inflation Forecast |
|---|---|---|---|
| 14 Oct 2021 | Scheduled (Oct) | Raised S$NEER slope slightly from 0% | First tightening post-COVID as global supply bottlenecks emerged. |
| 25 Jan 2022 | Off-Cycle | Raised S$NEER rate of appreciation slightly | Pre-emptive move ahead of April review as core inflation pressures broadened. |
| 14 Apr 2022 | Scheduled (Apr) | Double Tightening: Re-centred mid-point to prevailing level & increased slope slightly | Russia–Ukraine commodity shock; 2022 Core Forecast raised to 2.5%–3.5%. |
| 14 Jul 2022 | Off-Cycle | Re-centred S$NEER policy band mid-point up to prevailing level (slope & width unchanged) | June Core Inflation hit 4.4% YoY; 2022 Core Forecast lifted to 3.0%–4.0% (Headline 5.0%–6.0%). |
As MAS Managing Director Ravi Menon detailed at the MAS Annual Report 2021/22 Media Conference on 19 July 2022, a stronger trade-weighted Singapore dollar works through two channels: (1) the direct pass-through channel, which immediately lowers the S$-denominated cost of imported food, fuel, and intermediate inputs at the border, and (2) the indirect output-gap channel, which moderates external demand for Singapore goods and services, easing tightness in the domestic labour market:
4. Purchasing Power Erosion & Equity Valuation Under the Fisher Equation
From an asset allocation standpoint, inflation alters the math of every asset class via the Fisher Equation (1 + i = (1 + r)(1 + π), or approximately r ≈ i − π, where r is the real rate of return, i is the nominal yield, and π is inflation). When headline CPI runs at 6.7% in Singapore and 9.1% in the US while commercial bank savings accounts pay 0.05%–1.50%, holding excess idle cash guarantees a deep negative real return.

At the same time, in a Discounted Cash Flow (DCF) valuation framework, rising risk-free rates increase the Weighted Average Cost of Capital (WACC) in the denominator. Companies whose intrinsic value depends on speculative cash flows 10 to 15 years in the future suffer severe multiple compression, whereas Fundamental Value equities—businesses generating high near-term free-cash-flow yields, carrying low floating-rate debt, and possessing genuine pricing power to pass through inflation—offer far stronger downside protection and real compounding.
Sources, Official Reports & Media Credits
Central Bank & Statistical Releases (Published as of July 2022):
- Monetary Authority of Singapore (MAS). (14 July 2022). MAS Monetary Policy Statement – July 2022 (Off-Cycle Re-Centring of S$NEER Policy Band). mas.gov.sg.
- Monetary Authority of Singapore (MAS). (19 July 2022). MAS Annual Report 2021/2022 – Remarks by Mr Ravi Menon, Managing Director, MAS at the Media Conference. mas.gov.sg / Official MAS YouTube Broadcast.
- Monetary Authority of Singapore (MAS) & Ministry of Trade and Industry (MTI). (25 July 2022). Consumer Price Developments in June 2022 (Core Inflation at 4.4% YoY; CPI-All Items at 6.7% YoY). Department of Statistics Singapore (SingStat).
- Ministry of Trade and Industry Singapore (MTI). (14 July 2022). Singapore’s GDP Grew by 4.8 Per Cent in the Second Quarter of 2022 (Advance Estimates). mti.gov.sg.
- U.S. Bureau of Labor Statistics (BLS). (13 July 2022). Consumer Price Index Summary – June 2022 (All Urban Consumers CPI +9.1% YoY). bls.gov/cpi.
- Board of Governors of the Federal Reserve System. (27 July 2022). Federal Open Market Committee (FOMC) Statement – July 2022 (75 bps hike to 2.25%–2.50% target range). federalreserve.gov.
Image, Chart & Video Credits: Video broadcast credited to the Monetary Authority of Singapore (MAS Annual Report 2021/22 Media Conference); inflation arrow stock photography credited to Getty Images / iStockphoto (G0d4ather); macroeconomic AD–AS diagrams credited to standard Economics Online / educational macroeconomics curriculum charts.